School of Earth and Ocean Science, NUI Galway, Ireland
(Received March 2014; final version received September 2014)
1. Google Earth
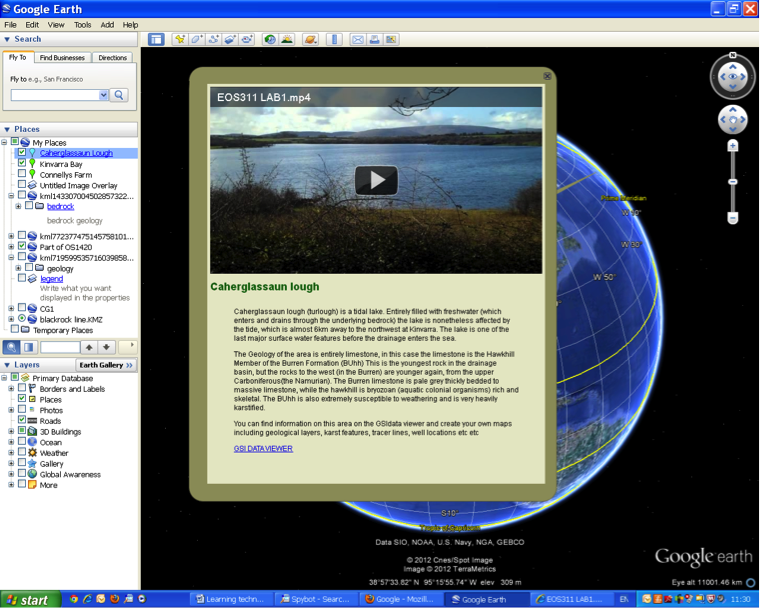
The 2004 launch of Google Earth marked a sea change in how spatial data could be viewed and shared. This free software is an interactive, virtual globe program permitting users to actively manipulate a virtual sphere representing Earth that is overlaid with satellite or high-resolution aerial imagery of continental regions and ocean islands (Figure 1). Numerous books have also been produced on its use, for example Brown (2006) and Crowder (2007). The paper by Butler (2006) argues that online tools, led by Google Earth, are changing the way we interact with spatial data. As of May 2011 the publishers Elsevier announced that Google Maps, basically an online and more simplified version of Google Earth, functionality is now available in its journals. This new feature enriches online articles on SciVerse, ScienceDirect with interactive maps, adapting to the requirements of each scientific discipline to visualize and interact with the author’s spatial data. The maps use Google KML (geographic annotation) file format and are created by the authors.
Google Earth uses a digital elevation model (DEM) collected by NASA’s Shuttle Radar Topography Mission (SRTM) as its base image. This means one can view the whole earth in 3D (to a resolution of ~15m)). Most commercial mapping and GIS software products now provide an export to Google Earth function. Users can add their own data layers, perhaps maps of groundwater flow patterns, more detailed topography maps and earthquake distribution maps for example. Users can also highlight areas of interest by inserting placemarks which contain information via text, weblinks.
Figure 1: Google Earth. Placemark balloon with field trip video embedded.
2. Publicly available data
In 2007 Mr. Noel Dempsey T.D., then Minister for Communications, Marine and Natural Resources, announced the open and free access to all Geological Survey of Ireland (GSI) digital data. Everything from regional scale geological maps, databases of groundwater wells, known karst features, bedrock thickness maps and all offshore data acquired during the Irish National Seabed survey. The data is made available over the Internet and access can be found on the following link mapping (Figure 2). Data is free to download and can be outputted in GIS shape files formats (used in sophisticated mapping and industry applications) or Google Earth file formats (public interest and teaching). While maps can be printed directly from this online tool it is not possible to import independent data into it.
This move by the Irish Government was not done in isolation. Worldwide Government agencies and research consortiums are making more and more data available e.g., the United States Geological Survey (USGS), National Oceanic and Atmospheric Administration (NOAA) and the Incorporated Research Institutions for Seismology (IRIS).
3. Student term long project
In the Environmental Geoscience 3rd year module in NUIG we get students working in groups to produce a report on the Geology and Hydrogeology of the Gort-Kinvarra catchment of South Co. Galway (Figure 3). This region is the focus of a large scale research project into groundwater and freshwater saltwater interaction which is being conducted by members of EOS. This report is an excellent training tool for the students before their independent 4th year projects and it would be a typical task once they are working in consultancy companies. For the report the students have to undertake a literature review into the Geological history and Groundwater regime of the area, find all available relevant data from Government agencies (known karst features, Groundwater flow indicators and Geological maps), evaluate that data, process additional experimental data we have gathered here in NUIG as part of our research project and then present the information in a short report using tables and maps for illustration.
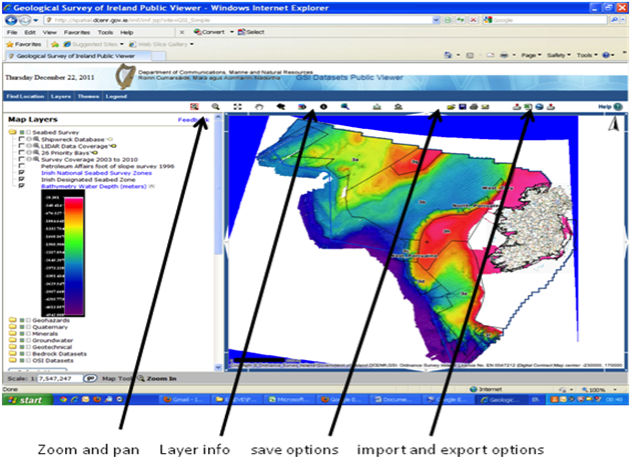
Figure 2: GSI data viewer.
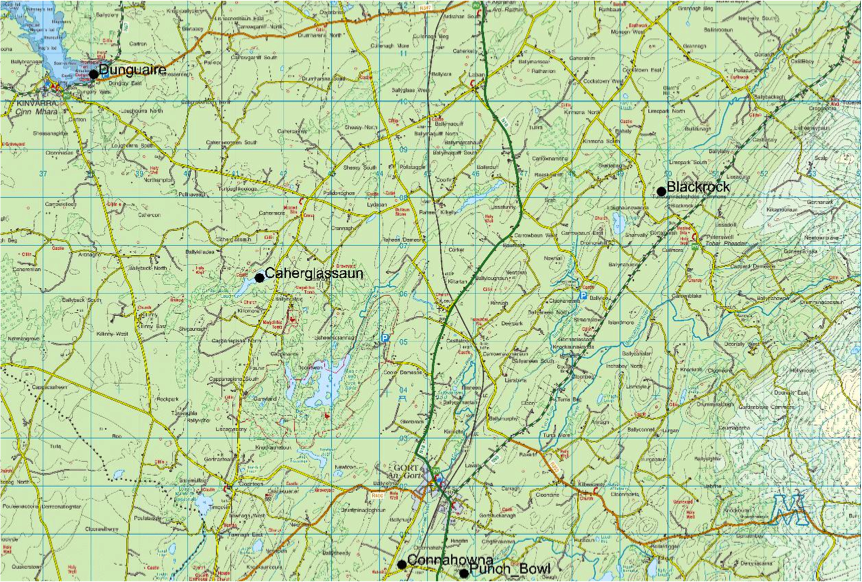
Figure 3: Field Trip stops. 1. Blackrock, 2. Punch bowel, 3. Connahowna, 4. Caherglassaun and 5. Dunguaire castle Kinvarra. Insert map of Ireland slows location of the study area.
3.1 Student practical session to support project
To give the students the practical skills to produce their report a practical session is run at the start of the course on digital map making and data collation. At the start of this session the students watch a virtual field trip of the study area created using Google Earth and the video editing software Camtasia. This video is available in Youtube (here) and embedded in Google Earth with the placemark function (Figure 1). Students are then directed to the GSI online data viewer, (via a weblink embedded in the placemark balloon in figure 1), to export data layers and import them into Google Earth. Here the students can explore the available data and are then shown how to export the bedrock geology data layer and import it into Google Earth where they overlay it on top of the OSI discovery series road map, edit the transparency of the geology layer so both the road map and geology are visible. Once this is done students can export the image from Google Earth into Microsoft PowerPoint where they can make map legends and add titles. An example of one student’s finished product is seen in Figure 4. Now the students have the necessary skills to produce whatever maps they need for their report. In another practical session students are shown how to import data layers created during the research project here in NUIG that are not available online via the public data viewers.
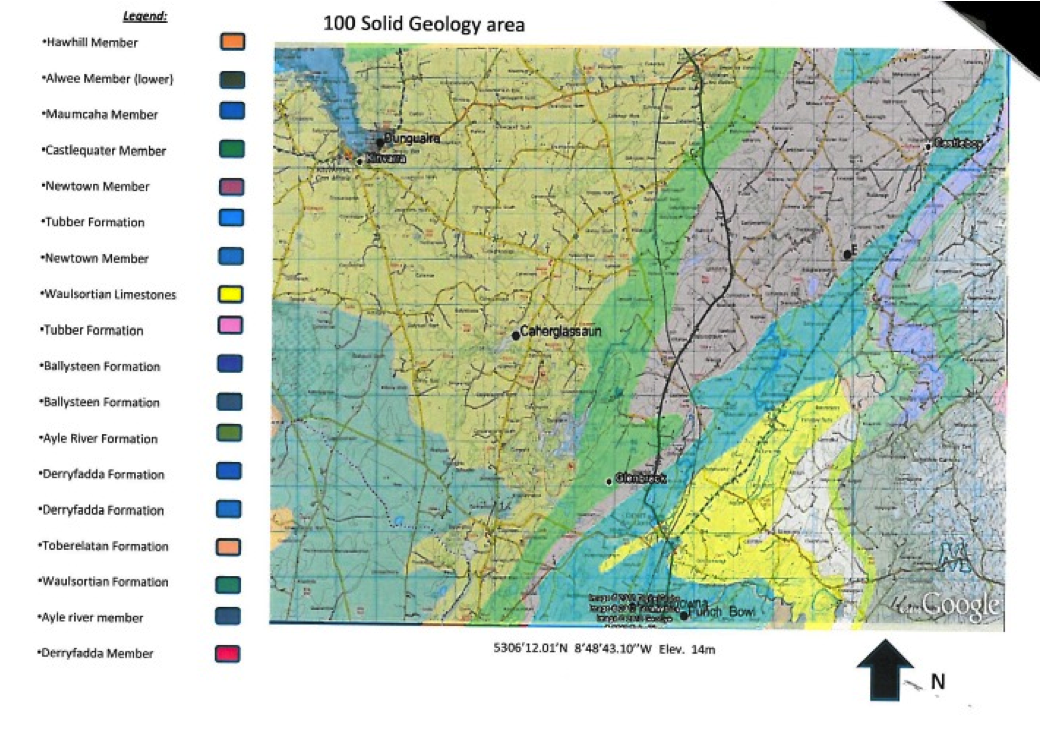
Figure 4: Sample of Student map produced with data from the GSI, the OS map given to them in class and the map legend from Microsoft PowerPoint. Note the Geology map is overlaying the OS road map
4. Conclusions
The advent of Google Earth, online public dataviewers along with the ever increasing ease of making movies are creating exciting opportunities to enhance teaching and the learning experience of our students. Although Google Earth is not the most sophisticated piece of software, it is free and along with Microsoft PowerPoint or the free Open Office it can be used to create simple digital maps. It is a very good tool to introduce students to the basic principles of digital map making before they start using advance spatial mapping Geographic information systems like ArcGIS. It also allows students and the public at large to explore their environment and ultimately become more engaged in Environmental governmental decision making.
References
Crowder. D.A., (2007) Google Earth for Dummies, Wiley Publishing, Incorporated
ISBN: 978-0-470-09525-7
Brown. M.C.(2006), Hacking Google Maps and Google Earth. Wiley Publishing, Incorporated
ISBN: 978-0-471-79009-9
Butler D., (2006). Virtual globes: The web-wide world. Nature 439, 776-778 doi:10.1038/439776a
Corresponding author. Email: eve.daly@nuigalway.ie
Irish Journal of Technology Enhanced Learning Ireland, 2014. © 2014 E. Daly. The Irish Journal of Technology Enhanced Learning Ireland is the journal of the Irish Learning Technology Association, an Irish-based professional and scholarly society and membership organisation. (CRO# 520231) http://www.ilta.ie/. This is an Open Access article distributed under the terms of the Creative Commons Attribution 4.0 International License (http://creativecommons.org/licenses/by/4.0/), allowing third parties to copy and redistribute the material in any medium or format and to remix, transform, and build upon the material for any purpose, even commercially, provided the original work is properly cited and states its license.